[ ]:
%matplotlib inline
Volshow
A simple volume rendering example
Using the pylab API
[1]:
import numpy as np
import ipyvolume as ipv
V = np.zeros((128,128,128)) # our 3d array
# outer box
V[30:-30,30:-30,30:-30] = 0.75
V[35:-35,35:-35,35:-35] = 0.0
# inner box
V[50:-50,50:-50,50:-50] = 0.25
V[55:-55,55:-55,55:-55] = 0.0

ipv.figure()
ipv.volshow(V, level=[0.25, 0.75], opacity=0.03, level_width=0.1, data_min=0, data_max=1)
ipv.view(-30, 40)
ipv.show()
/Users/maartenbreddels/src/ipyvolume/ipyvolume/serialize.py:92: RuntimeWarning: invalid value encountered in true_divide
  gradient = gradient / np.sqrt(gradient[0] ** 2 + gradient[1] ** 2 + gradient[2] ** 2)
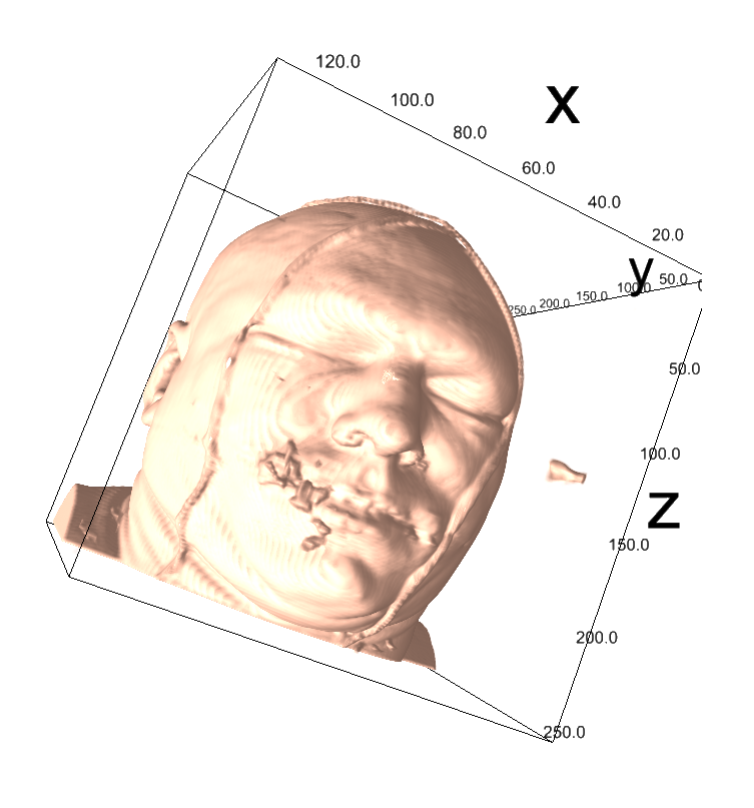
Visualizating a scan of a male head
Included in ipyvolume, is a visualuzation of a scan of a human head, see the sourcecode for more details.
[ ]:
import ipyvolume as ipv
fig = ipv.figure()
vol_head = ipv.examples.head(max_shape=128);
vol_head.ray_steps = 800
ipv.view(90, 0)