Bar charts
This is ‘abusing’ the scatter object to create a 3d bar chart
[1]:
import ipyvolume as ipv
import numpy as np
[2]:
# set up data similar to animation notebook

u_scale = 10
Nx, Ny = 30, 15
u = np.linspace(-u_scale, u_scale, Nx)
v = np.linspace(-u_scale, u_scale, Ny)
x, y = np.meshgrid(u, v, indexing='ij')
r = np.sqrt(x**2+y**2)
x = x.flatten()
y = y.flatten()
r = r.flatten()

time = np.linspace(0, np.pi*2, 15)
z = np.array([(np.cos(r + t) * np.exp(-r/5)) for t in time])
zz = z
[ ]:
[3]:
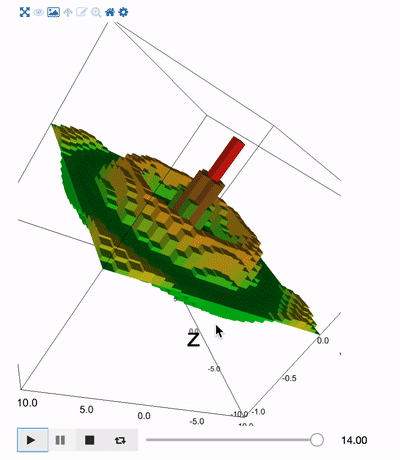
fig = ipv.figure()
s = ipv.scatter(x, 0, y, aux=zz, marker="sphere")
dx = u[1] - u[0]
dy = v[1] - v[0]
# make the x and z lim half a 'box' larger
ipv.xlim(-u_scale-dx/2, u_scale+dx/2)
ipv.zlim(-u_scale-dx/2, u_scale+dx/2)
ipv.ylim(-1.2, 1.2)
ipv.show()
We now make boxes, that fit exactly in the volume, by giving them a size of 1, in domain coordinates (so 1 unit as read of by the x-axis etc)
[4]:
# make the size 1, in domain coordinates (so 1 unit as read of by the x-axis etc)
s.geo = 'box'
s.size = 1
s.size_x_scale = fig.scales['x']
s.size_y_scale = fig.scales['y']
s.size_z_scale = fig.scales['z']
[5]:
s.shader_snippets = {'size':
 'size_vector.y = SCALE_SIZE_Y(aux_current); '
}
Using a shader snippet (that runs on the GPU), we set the y size equal to the aux value. However, since the box has size 1 around the origin of (0,0,0), we need to translate it up in the y direction by 0.5.
[6]:
s.shader_snippets = {'size':
 'size_vector.y = SCALE_SIZE_Y(aux_current) - SCALE_SIZE_Y(0.0) ; '
}

s.geo_matrix = [dx, 0, 0, 0,   0, 1, 0, 0,   0, 0, dy, 0,  0.0, 0.5, 0, 1]
Since we see the boxes with negative sizes inside out, we made the material double sided
[7]:
# since we see the boxes with negative sizes inside out, we made the material double sided
s.material.side = "DoubleSide"
[8]:
# Now also include, color, which containts rgb values
color = np.array([[np.cos(r + t), 1-np.abs(z[i]), 0.1+z[i]*0] for i, t in enumerate(time)])
color = np.transpose(color, (0, 2, 1)) # flip the last axes
s.color = color
[9]:
ipv.animation_control(s, interval=200)
Spherical bar charts
[10]:
# Create spherical coordinates
u = np.linspace(0, 1, Nx)
v = np.linspace(0, 1, Ny)
u, v = np.meshgrid(u, v, indexing='ij')
phi = u * 2 * np.pi
theta = v * np.pi
radius = 1
xs = radius * np.cos(phi) * np.sin(theta)
ys = radius * np.sin(phi) * np.sin(theta)
zs = radius * np.cos(theta)
xs = xs.flatten()
ys = ys.flatten()
zs = zs.flatten()
[11]:
fig = ipv.figure()
# we use the coordinates as the normals, and thus direction
s = ipv.scatter(xs, ys, zs, vx=xs, vy=ys, vz=zs, aux=zz, color=color, marker="cylinder_hr")
ipv.xyzlim(2)
ipv.show()
[12]:
ipv.animation_control(s, interval=200)
[13]:
import bqplot
# the aux range is from -1 to 1, but if we put 0 as min, negative values will go inside
# the max determines the 'height' of the bars
aux_scale = bqplot.LinearScale(min=0, max=5)
s.aux_scale = aux_scale
[14]:
s.shader_snippets = {'size':
 '''float sc = (SCALE_AUX(aux_current) - SCALE_AUX(0.0)); size_vector.y = sc;
 '''}
s.material.side = "DoubleSide"
s.size = 2
s.geo_matrix = [1, 0, 0, 0,   0, 1, 0, 0,   0, 0, 1, 0,  0.0, 0.5, 0, 1]
[15]:
ipv.style.box_off()
ipv.style.axes_off()