Using scales
Instead of the (default) linear scales, ipyvolume also support bqlot’s scales, for instance, the logaritmic scales.
[1]:
import ipyvolume as ipv
import bqplot.scales
import numpy as np
import ipywidgets as widgets
N = 500
x, y, z = np.random.normal(0, 1, (3, N))
x = 10**x
r = np.sqrt(np.log10(x)**2 + y**2 + z**2)
[2]:
scales = {
    'x': bqplot.scales.LogScale(min=10**-3, max=10**3),
    'y': bqplot.scales.LinearScale(min=-3, max=3),
    'z': bqplot.scales.LinearScale(min=-3, max=3),
}
color_scale = bqplot.scales.ColorScale(min=0, max=3, colors=["#f00", "#0f0", "#00f"])
[3]:
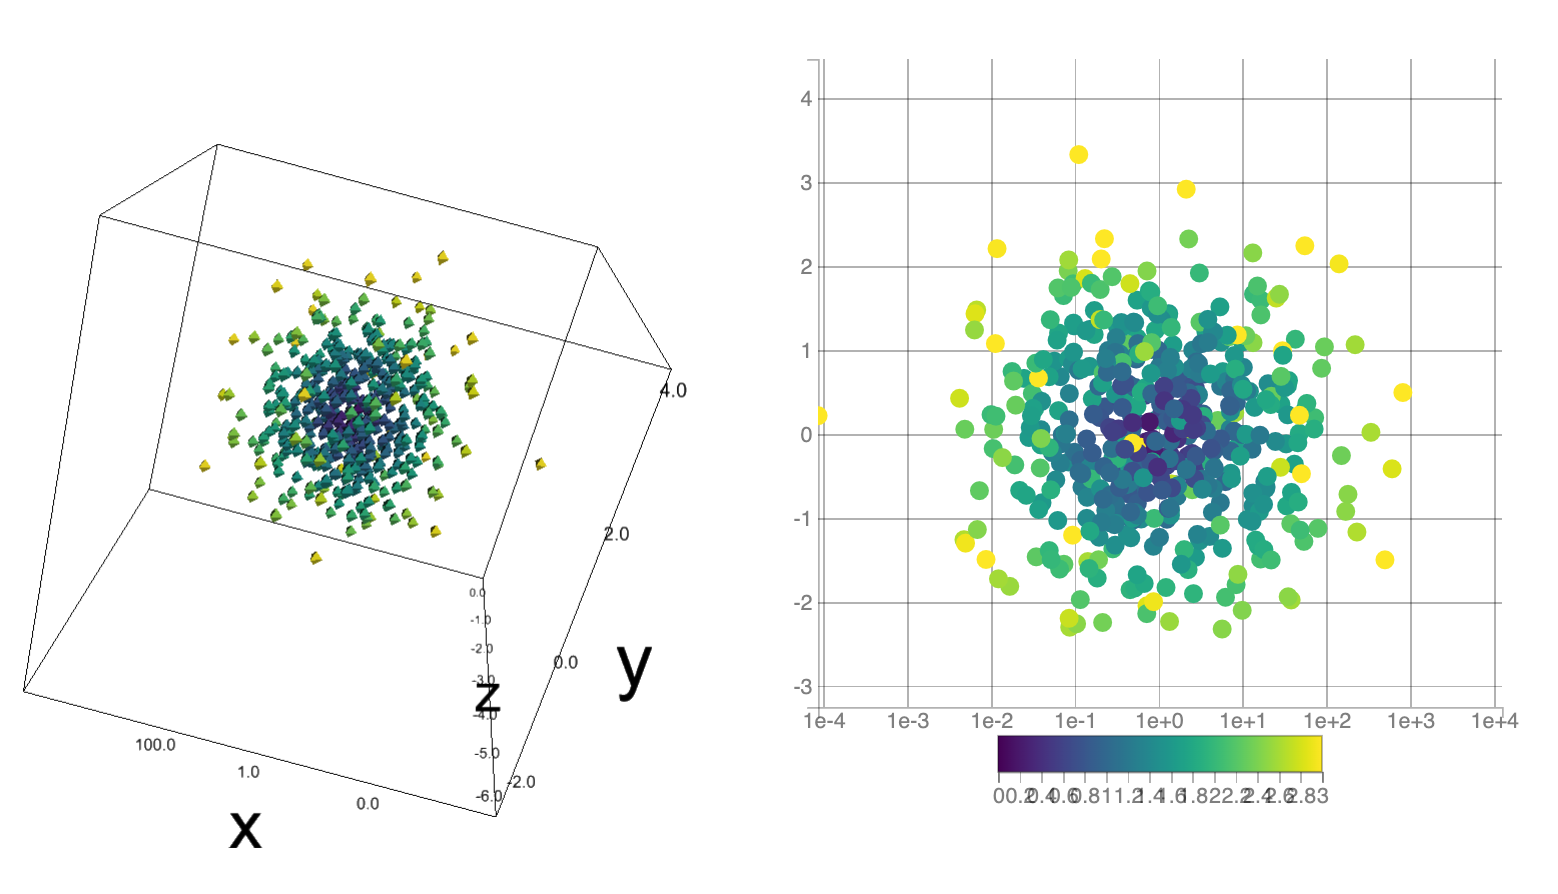
fig = ipv.figure(scales=scales)
scatter = ipv.scatter(x, y, z, color=r, color_scale=color_scale)
ipv.view(150, 30, distance=2.5)
ipv.show()
Note that the x-axis is logarithmically spaced and labeled.
We also use the bqplot color scale, and instead of setting a list of colors, we can also set a famour color scheme:
[4]:
scatter.color_scale.colors = []
scatter.color_scale.scheme = 'viridis'
Linking a widget to the scale, allows us to easily change its properties
[5]:
color_max_slider = widgets.FloatSlider(min=1, max=5, description='Color max')
widgets.jslink((color_scale, 'max'), (color_max_slider, 'value'))
color_max_slider
[6]:
z_max_slider = widgets.FloatSlider(min=1, max=10, description='Z max')
widgets.jslink((fig.scales['z'], 'max'), (z_max_slider, 'value'))
z_max_slider
Using the same scales in bqplot
[7]:
import bqplot.pyplot as plt
fig2d = plt.figure(layout={'width': '500px'})
scatter2d = plt.scatter(x=(x), y=y, color=scatter.color, scales={
    "x": fig.scales["x"],
    "y": fig.scales["y"],
    "color": scatter.color_scale
})
plt.show()
Try zooming/panning in both bqplot and ipyvolume! For ipyvolume, keep the option key pressed, while using scroll or drag.
[8]:
# Putting the 2 figures next to eachother.
# TODO: currently not working
# widgets.VBox([fig, fig2d])